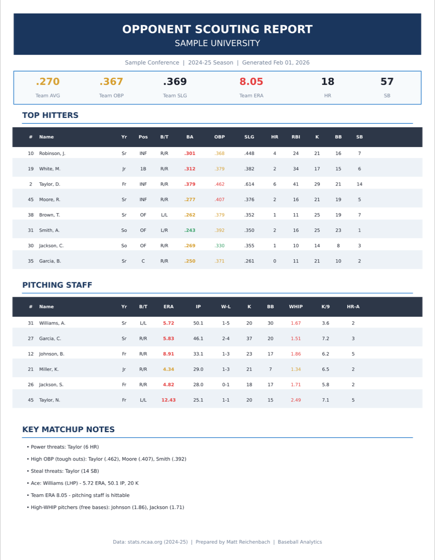
Opponent scouting reports
Batting splits, batted ball tendencies, baserunning threats and written scouting notes on the lineup you are about to face.
Opponent breakdowns and pitching analytics for college baseball and softball. Affordable, customizable, repeatable: built from the data you already have and waiting in your folder before the series.
Used by dozens of coaches across dozens of conferences, baseball and softball, D2 through JUCO. In season that runs three to five reports a week, and an opponent breakdown is built off roughly 1,800 tracked pitches.
The analytics side of the game got good fast, and nearly all of it got built for budgets a D2, D3, NAIA or JUCO program does not have. So a coach copies numbers off a stat page at eleven at night, or the staff plays the series without a report. Same story in softball.
The data is not the problem. It is already sitting in the pitch-tracking export your park produces, in the radar and camera tracking exports your staff downloads and never opens again, and in the conference and NCAA pages anybody can read. What is missing is the eight hours a week it takes to turn that into pages a staff can use on Tuesday.
A staff opens the opponent report and gets to something usable in about a minute: their three hole hitter chases up and away in two strike counts, so that is where you finish him, and their Friday starter goes to the slider 67 percent of the time when he is ahead, so your hitters sit on it. That is the whole point of the page.
Batting splits, batted ball tendencies, baserunning threats and written scouting notes on the lineup you are about to face.
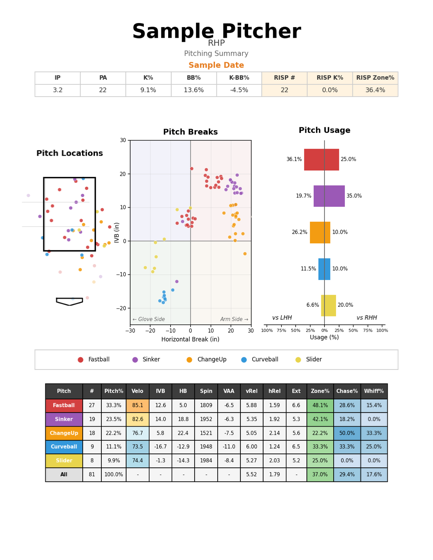
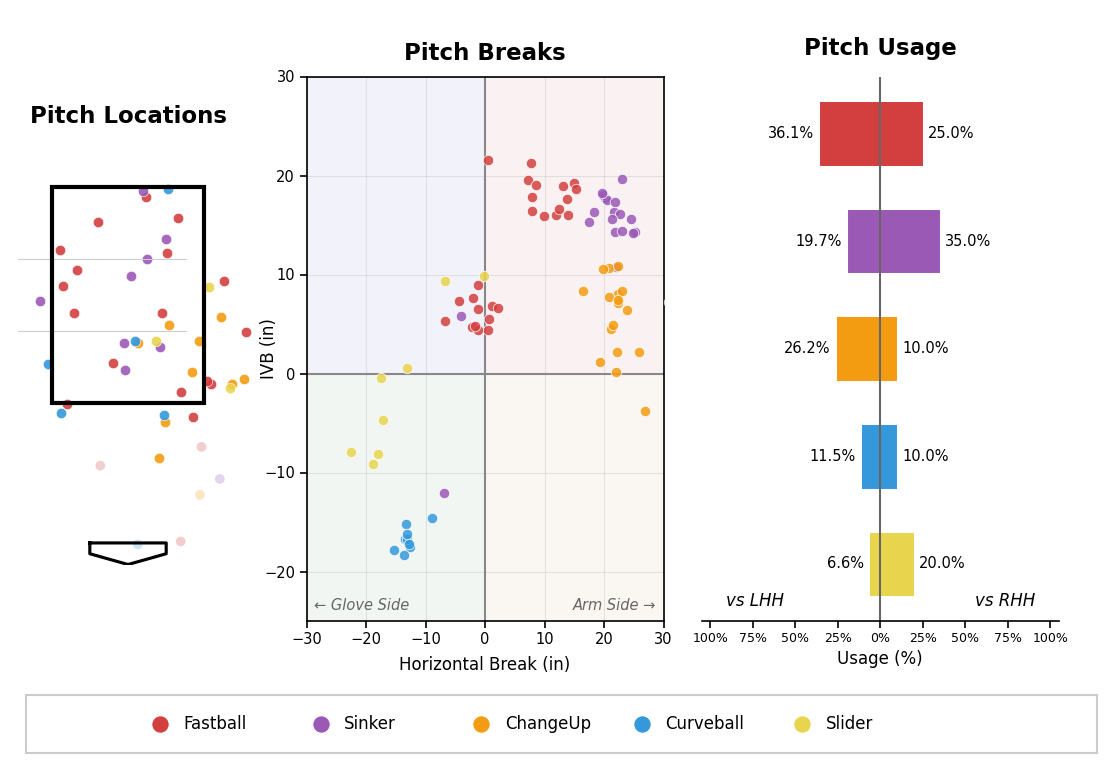
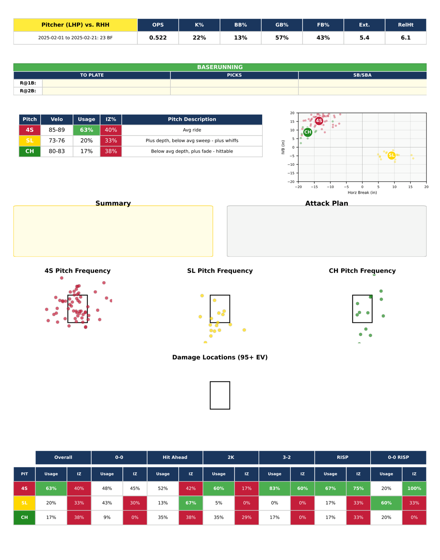
Arsenal grading, strike zone heatmaps, usage by count, and splits against left and right handed hitters.
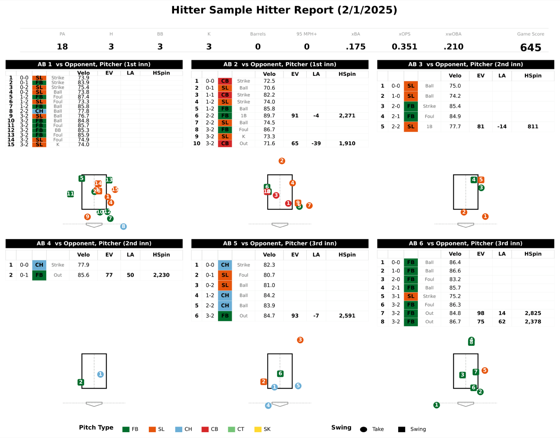
Plate appearance by plate appearance detail, pitch sequences, contact quality and where a hitter does damage.
Where your program sits against the rest of the league on plate discipline, scoring efficiency and pitching balance.
One setup conversation, and the exports and stats your program already collects land somewhere we can both see. The first report or two are a conversation: what your staff reads, what it ignores, what is missing. That is the customizable part, and it is the only part that takes your time.
Every number comes out of code that runs the same way every time. The written notes are generated from those computed values only, so if a fact is not in the data it does not appear in the prose. The AI stays in the pipeline, not on the page. Then a person reads the finished report, because a page that would waste a staff meeting should not get sent.
A finished PDF, ready to print. Once we have worked out the reporting you want, it repeats: same pages, same format, ahead of every series, with nothing for a coach to remember to ask for.
Names and teams are replaced with sample data. The layout, the math and the charts are exactly what a coach receives.
"Coaches at D2/D3 don't have time to build these reports themselves. The industry is going visual. This market is underserved."
Sessions for staffs that want to use AI tools themselves, taught by a coach who builds with them every day.
Learn to use AI in your programRankings for D2, D3, NAIA and JUCO baseball and softball, built the same way at every level, with the method published alongside.
See what is comingGet started
A short form to start: your level, your sport, and what you already collect. From there it is one conversation, a shared folder, and reports start showing up. Onboarding is done by hand on purpose, so nothing lands in your folder that a coach would not use.